


The property downturn is official …
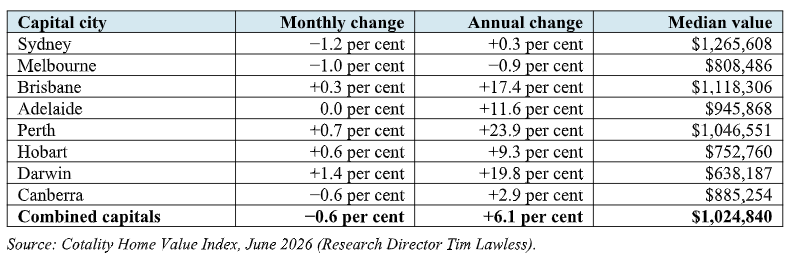
The numbers have caught up with the soft auctions and quiet open homes. Property data house Cotality’s national Home Value Index fell 0.4 per cent in June – the largest monthly fall since December 2022. Cotality now judges the market to have peaked in March.
Sydney led the slide (down 1.2 per cent), followed by Melbourne (down 1 per cent) and Canberra (down 0.6 per cent), while the boom-time capitals have hit the brakes: Adelaide was flat, and Brisbane and Perth managed only modest gains.
Cotality’s Research Director Tim Lawless blames a triple whammy: stretched affordability, cost-of-living pressure and 0.75 per cent of rate rises this year, with auction clearance rates at COVID-era lows signalling buyers and sellers can’t agree on price.
When that happens, sellers usually blink first.
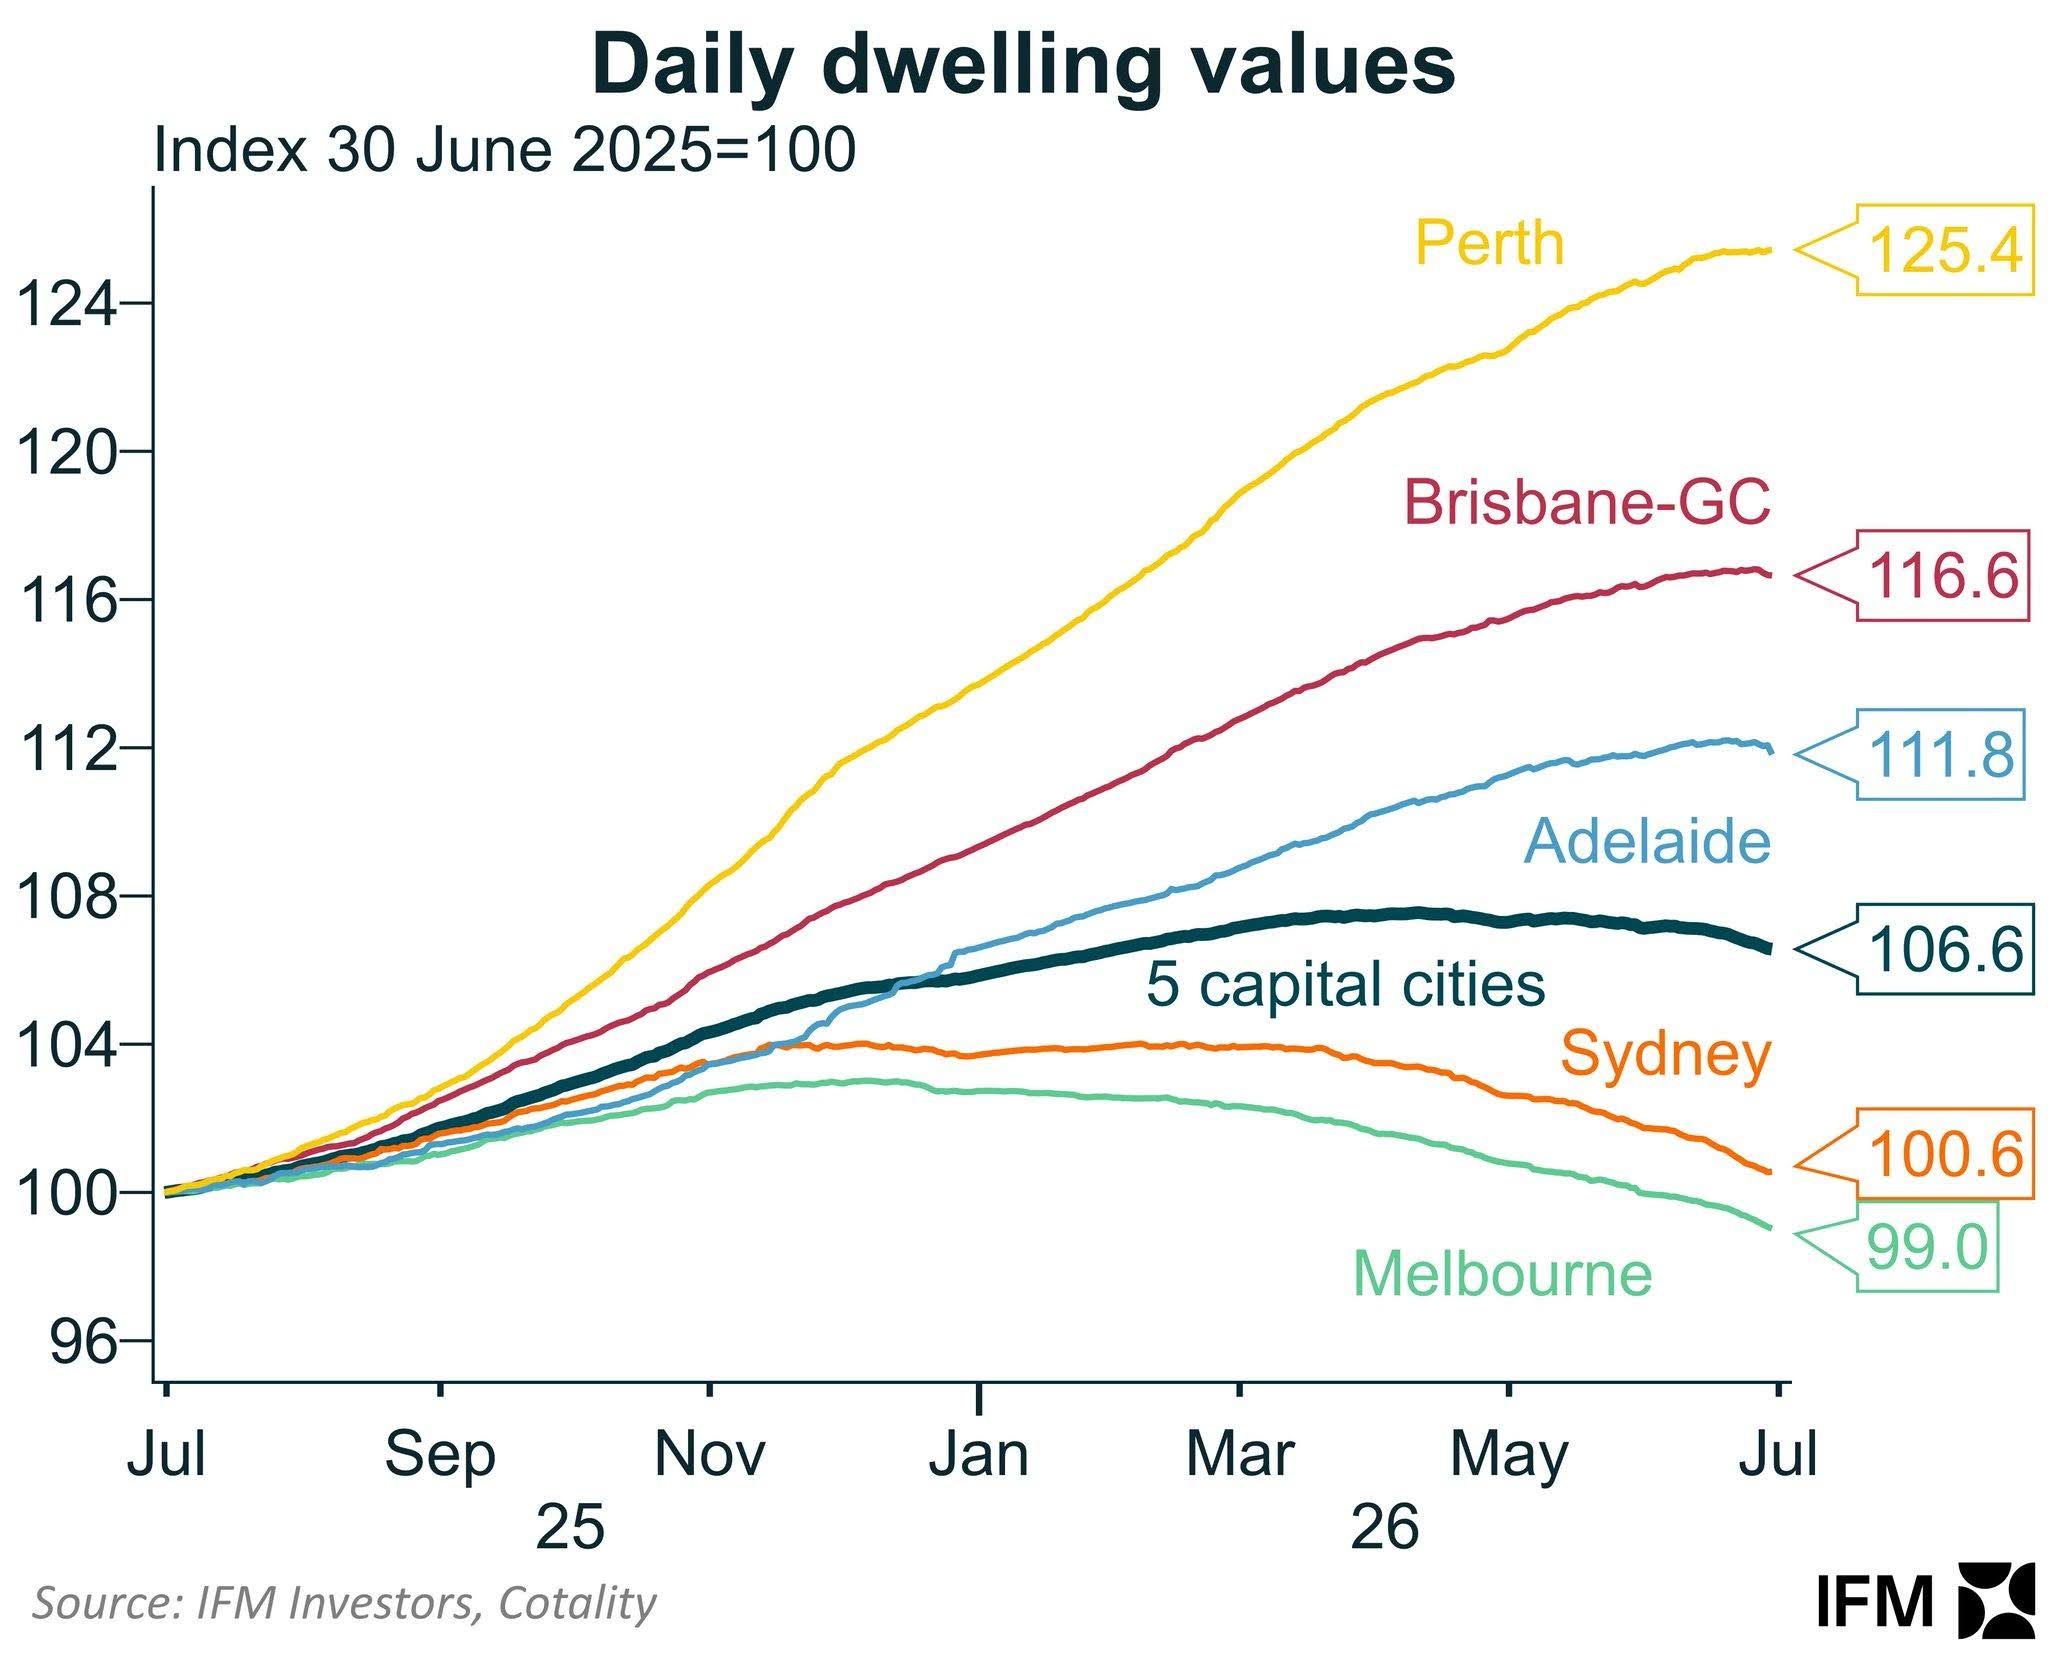
The chart below from IFM Investors, using Cotality’s daily index, puts June in context.
Sydney values are back to almost exactly where they were a year ago and Melbourne has slipped just below. Perth is still up around 24 per cent, Brisbane 17 per cent and Adelaide nearly 12 per cent.
This isn’t a nationwide property slump. It’s the two biggest markets giving back some of their recent gains, while much of the rest of the country remains well ahead.
Why a crash is still unlikely: The five-year buffer
So, is this the start of the housing crash the doomsayers predict every year? Ray White chief economist Nerida Conisbee doesn’t think so.
She points to a chronic housing shortage, strong population growth and constrained construction continuing to put a floor under prices.
And a five-year history backs her emphatically.
I’ve taken Cotality’s five-year growth figures and calculated the fall needed just to get back to mid-2021 prices:
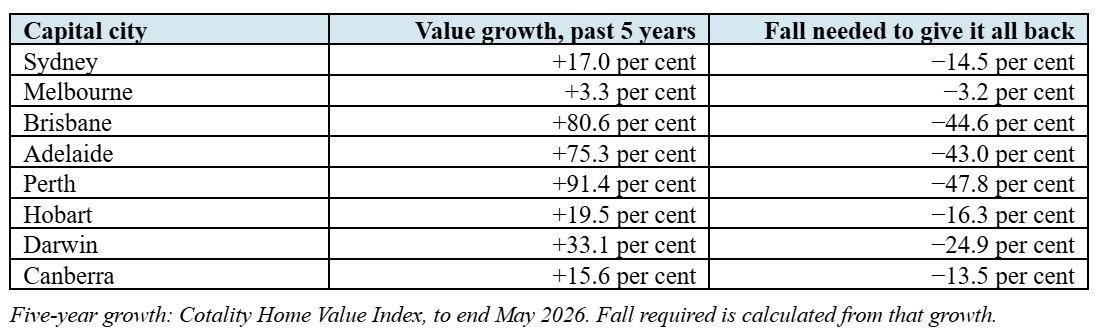
Perth would need to almost halve, while Brisbane and Adelaide would need to fall by more than 40 per cent.
Nobody is forecasting anything close to that. June’s “biggest fall in three and a half years” was just 0.4 per cent. Melbourne is the only city with a relatively thin buffer, which helps explain why it continues to underperform the national story.
But Nerida’s headline comes with a caveat: the cheaper suburbs are where the highest risk is gathering.
The Federal Government’s expanded 5 per cent deposit scheme supercharged the affordable end of the property market. ABS figures show first home buyer lending up 7.2 per cent nationally and 15.8 per cent in NSW, with under-threshold suburbs strongly outperforming since.
Now the Budget is pushing investors out of those same suburbs, and 5 per cent deposit buyers have wafer-thin equity. A modest dip in values could leave some owing more than their home is worth.
Banks hate negative equity. But it only matters if you have to sell. Otherwise, it’s about staying the course: keep repaying and focus on building your buffer.
A market correction?
The latest data shows the property market has clearly rolled over into a mild downturn, led by Sydney and Melbourne, but this is likely more of a correction than a broad crash, with most other cities still well above pre-pandemic levels.
Also, undersupply and population growth continue to support prices.
That said, watch the edges of the market, where even small falls can quickly strain already thin equity buffers.