


Surging property values in Sydney and Melbourne during November, along with a housing rebound in Perth, has delivered the biggest increase in national house prices in 16 years.
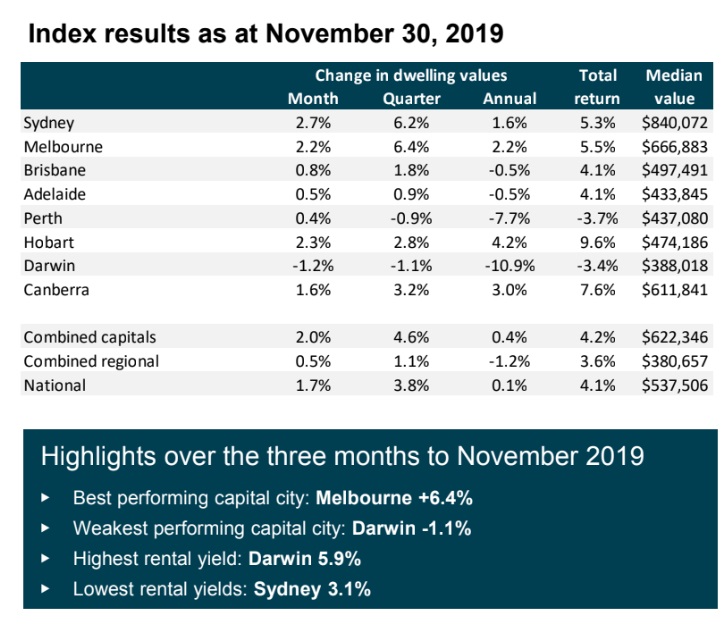
- Sydney and Melbourne property prices rose 2.7% and 2.2% respectively in November
- Those increases, along with Perth rebounding, led to the biggest monthly jump in national house prices since 2003
- CoreLogic’s national Home Value Index surged 1.7% higher in November, the 5th consecutive monthly increase
- Dwelling prices rose in seven of the eight capital cities in November.
CoreLogic’s national Home Value Index rose 1.7% in November, the 5th consecutive monthly increase, as a combination of interest rate cuts and reduced supply helped drive up prices.
The national index is now back in positive annual growth for the first time since April 2018, with dwelling values 0.1% higher over the past 12 months. Since its trough in June, the national dwelling value index has recovered by 4.7%. While the national level remains 4.1% below its 2017 peak, it’s now tracking roughly at the same level as the January 2017 index results.
House prices rose by 2.1% and apartment prices lifted by 1.6%. House prices were up 0.1% on a year ago and prices of apartments increased by 1.4%. In regional areas, house and apartment prices rose by 0.5%, although regional home prices are down 1.2% on the year to November.
The average (median) Australian capital city house price was $652,446 and for units, the average was $563,439 in November.
The country’s two biggest property markets, Sydney and Melbourne, rose 2.7% and 2.2% respectively in November, with Perth rising 0.4% higher, the first month-on-month uptick since the downtrend took a pause in early 2018 after a four-year decline. The only capital where prices fell in November was Darwin, down 1.2%.
Perth’s property market is still down a cumulative 21.3% at the end of November as the WA capital has gone from being the most expensive across the capital cities to now be the lowest over the last 13 years.
Source: Corelogic
Four capitals moved back into positive annual growth, led by Hobart (+4.2%), Canberra (+3.0%), Melbourne (+2.2%) and Sydney (+1.6%), while the largest declines remain in Darwin (-10.9%) and Perth (-7.7%).
CoreLogic Research’s Tim Lawless said the synergy of a 75 basis points rate cut from the Reserve Bank, a loosening in loan serviceability policy from APRA, and concerns over Labor’s negative gearing policy after the Coalition election win were central to the rebound.
“Additionally, we’re seeing advertised stock levels persistently low, creating a sense of urgency in the market as buyer demand picks up,” he said.
“There’s also the prospect that interest rates are likely to fall further over the coming months and an improvement in housing affordability following the recent downturn are other factors supporting a lift in values.”
In good news for regional Australians, housing values are generally rising there too, albeit at milder levels relative to the capitals.
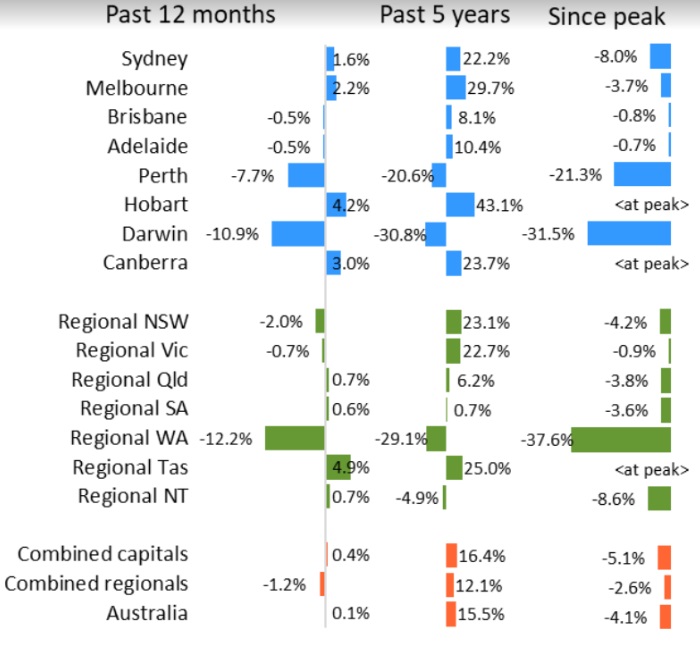
CoreLogic’s combined capital cities index is 4.6% higher over the past three months with values recovering by 5.7% since bottoming out in June. The combined regionals index is up a smaller 1.1% over the past three months and values have recovered only 1.1% since finding a floor in August.
Across the broader regional areas of the states, Tasmania is seeing the strongest growth with values up 2.2% over the past three months, followed by Queensland (+1.8%), NSW (+1.2%) and Victoria (+1.0%).
Lawless said the last five months have delivered an unexpected period of rapid recovery, which begs the question how long can such a high pace of capital gains be sustained?
“Annualising the growth rate over the past three months implies the national index is already tracking well above double digit annual growth (+15.3%), while Sydney and Melbourne dwellings are tracking around the mid-twenty percent range for annualised capital gains based on the most recent three month trend,” he said.
“Considering wages and household income growth remains low, economic conditions are losing momentum and housing
affordability is once again worsening (from an already high base in the largest cities), there are likely to be some headwinds in maintaining such a fast recovery.”
Australian property value changes
Source: CoreLogic
Top and bottom 10 sub-regions for growth
Over the past 12 months, 22 of the 46 sub-regions have recorded a decline in dwelling values. The strongest sub-regions for growth across the capital cities are now in areas of Melbourne and Sydney’s prestige market.
Melbourne’s Inner East, where the median dwelling value is $1.18 million, has surged back to positive annual growth, up 8.0% over the past twelve months.
The rapid bounce back follows a significant decline in values across the region, where values fell 18.0% from peak to trough. The largest declines are generally confined to areas of Perth and Darwin, which comprise eight of the ten largest dwelling value declines over the past year.
The past three months has seen only six of the 46 capital city sub-regions – in Perth and Darwin – recorded a fall in home values, comprised of areas across Perth as well as Darwin. The best performing capital city sub-regions over the past three months were located in Sydney and Melbourne, with Sydney’s Ryde (+9.3%) and Melbourne’s Inner East (+9.0%) recording the highest capital gains.
Across the 42 regional areas of Australia, 17 recorded a rise in values over the past 12 months.
Tasmania continues to show the best capital gains, at least on an annual basis, with values across the West/North West SA4 region up almost 6% over the past 12 months and values across the South East region 5.3% higher.
The weakest regional markets continued to be the broader outback regions of Queensland and South Australia, as well as many of the agricultural regions around the country which continue to be adversely affected by drought.
Twenty-five of the 42 regional areas recorded a rise over the three months ending November. The cities surrounding Sydney and Melbourne, including Illawarra (+4.2%), Newcastle & Lake Macquarie (+2.8%), Bendigo (+1.0%), Geelong (+1.0%) and Ballarat (+0.5%) are now trending higher. Eastern Seaboard lifestyle markets are also lifting, with areas like Sunshine Coast (+2.7%), Gold Coast (+2.2%), Cairns (+2.7%), Richmond- Tweed (+0.7%) and Wide Bay (+0.7%) all reporting higher home values
Tim Lawless said the recovery trend is most concentrated within the premium sector of the market and most evident in Sydney and Melbourne where the top quartile of the market is outperforming the broad ‘middle’ of the market and lower quartile.
Values across Sydney’s top quartile were up 7.4% over the three months ending November, compared with a 3.8% rise across the lower quartile. Similarly, in Melbourne, top quartile values were up 8.1% over the same three month period compared with a 4.2% rise across the lower quartile. Brisbane, Perth and Darwin are also recording a similar trend where premium value properties are outperforming lower value properties.
“The stronger performance across the higher value end of the market can likely be attributed to a combination of values falling more in this sector during the downturn, as well as recent adjustments to serviceability rules which has boosted borrowing capacity,” Lawless said
“Additionally, the scarcity value of detached homes in many of the blue-chip property markets is another factor supporting strong capital gains. As housing values become less affordable in these high-end markets, demand is likely to ripple outwards to the more affordable areas.”
Rental returns flat
Rents continued to trend lower in Sydney (-0.1% in November) and were also down slightly in Hobart (-0.6%) and Darwin (-0.5%). The remaining capital cities are generally seeing weak rental market conditions. On an annual basis, the largest rental increases are in Hobart (+5.8%) and Perth (+2.3%), with rents down 1.5% in Sydney and 2.5% lower in Darwin over the year.
Tim Lawless said the softer rental conditions can be attributed to a range of factors including the recent history of rising rental supply, and a significant increase in dwelling construction skewed towards rental accommodation in the high rise apartment sector.
“Additionally, a larger than normal number of renters have transitioned to first home buyers, thereby denting rental demand,” he said.
As dwelling values trend higher and rental growth remains low, gross rental yields are starting to compress. Across the combined capitals, gross rental yields moved through a recent peak in May earlier this year at 3.88%. Since that time, gross rental yields across the combined capitals have reduced back to 3.56% which is the lowest gross yield since July last year.
NOW READ: Australia’s property market could be just 12 months away from new peaks that spark more regulation