


Wage growth low… and could stay that way for a while
No surprises in the latest wage data with growth weak in line with the job market. What was surprising is that wage growth edged higher in the three months to June.
The Wage Price Index (WPI) rose 0.2 per cent in the June quarter but over the year growth fell from 2.2 per cent to a record low of 1.8 per cent… the slowest annual growth rate on record.
Remember in the last quarter we had “deflation” (the CPI going down) so the good news is that wages are holding up compared with prices so there are healthy real gains.
The casualties of the slow wage growth are high income earners with senior executives rather than ordinary workers taking the biggest hit.
Private sector wages rose by 0.1 per cent to be up 1.7 per cent from a year ago but public sector (Government jobs) wages rose by 0.6 per cent to be up by 2.1 per cent over the year.
Superannuation recovering nicely
According to estimates from leading superannuation research house SuperRatings, the median balanced option returned 0.9 per cent in July as markets continued to rebuild following March’s sharemarket crash. Overall, super funds have made it through in good shape but are preparing for more market volatility through the rest of the 2020 calendar year.
According to SuperRatings’ estimates, the median balanced option is down 1.2 per cent over the 12 months to July. The median growth option is estimated to have fallen -1.7 per cent while the median capital stable option is steady at 0.5 per cent.
Accumulation returns to end of July 2020
| CYTD | 1 yr | 3 yrs (p.a.) | 5 yrs (p.a.) | 7 yrs (p.a.) | 10 yrs (p.a) | |
| SR50 Growth (77-90) Index | -5.1% | -1.7% | 5.8% | 5.9% | 7.7% | 7.8% |
| SR50 Balanced (60-76) Index | -4.0% | -1.2% | 5.5% | 5.3% | 6.9% | 7.4% |
| SR50 Capital Stable (20-40) Index | -0.9% | 0.5% | 3.7% | 3.8% | 4.6% | 5.1% |
Source: SuperRatings estimates
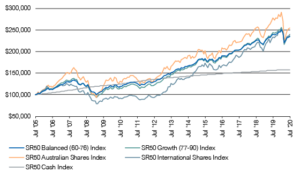
Growth in $100,000 invested over 15 years to July 30, 2020
Commonwealth Bank flexes its financial muscle
Commonwealth Bank is the premium stock of the “Big 4” and released its annual result during the week. And, given the environment, was pretty impressive.
It reported a cash profit of $7.3 billion, which was down 11.3 per cent on FY19. And while it cut final dividend to 98 cents from last year’s $2.31 it was the maximum it was allowed to pay under the guidance rules of the banking regulator… APRA.
Basically, it has set a high bar for the other banks to follow suit and pay out the maximum allowable dividend to shareholders… if they can.
This result shows why investors pay a premium for CBA shares compared with the other three big banks.
I interviewed CBA chief executive, Matt Comyn, on Ausbiz straight after he announced the results.
He told me; “Fortunately, we completed some divestments during the financial year, particularly in the first half, that created a substantial gain on sale which helped our statutory profit increase by 12 per cent. The statutory profit is important because it’s the basis on which our capital is calculated.
“It’s also the way APRA views their guidance around dividends. It meant that we could go up to 49.95 per cent of our statutory profit and declare a fully franked dividend of 98 cents. We feel like our balance sheet is in very good condition – we’ve got more than $5 billion of surplus capital over an above APRA’s unquestionably strong capital benchmark.”
Matt also said customer home loan deferrals have come down thanks to government stimulus but uncertainty remains.
“Overall their LVRs (Loan as a percentage of property valuation)… are in a healthy position. The housing market has been more robust than we would have otherwise expected. But unemployment, which we’ve forecast is going to peak somewhere between nine and 10 percent later this calendar year, subject to what’s happening with the participation rate, is going to put strain on individual families and households.”
Property rents still declining
In a continuing sign of a weak property market asking rents are continuing to fall according data from property research house SQM Research.
Capital city average asking rents decreased 0.6 per cent for houses and 0.9 per cent for units for the week ending 4 August 2020.
Sydney, Melbourne and Brisbane recorded declines in asking rents for both houses and units over the month. Melbourne recorded the highest decrease of 1.4 per cent for both houses and units.
Perth, Adelaide, Canberra, Darwin and Hobart recorded increases in house and unit asking rents. Perth recorded the highest increase in asking rents for houses by 3.2 per cent and Hobart’s unit market increased by 5.9 per cent.
Year on year, Sydney, Melbourne, Darwin and Hobart also recorded declines in asking rents for both houses and units, Sydney in particular recording a high 7.8 per cent decline for houses and 6.8 per cent decline for units in July 2019.
| SQM Research Weekly Rents Index | |||||
| Week ending: 4 August 2020 | Rent | Change on prev week |
Rolling month % change |
12 month % change |
|
| Sydney | All Houses | 634.0 | -4.0 | -1.0% | -7.8% |
| All Units | 466.3 | -1.3 | -1.2% | -6.8% | |
| Melbourne | All Houses | 520.8 | -2.8 | -1.4% | -1.3% |
| All Units | 397.3 | -1.3 | -1.4% | -5.8% | |
| Brisbane | All Houses | 466.2 | -1.2 | -0.3% | 0.9% |
| All Units | 380.0 | 0.0 | -0.2% | 1.6% | |
| Perth | All Houses | 469.5 | 0.5 | 3.2% | 8.6% |
| All Units | 352.8 | 1.2 | 0.1% | 3.8% | |
| Adelaide | All Houses | 413.2 | 0.8 | 0.6% | 3.7% |
| All Units | 318.4 | 0.6 | 0.7% | 2.1% | |
| Canberra | All Houses | 627.7 | 8.3 | 1.4% | 2.2% |
| All Units | 474.1 | 0.9 | 0.4% | 3.0% | |
| Darwin | All Houses | 490.6 | 5.4 | 1.3% | -5.4% |
| All Units | 359.7 | -3.7 | 0.8% | -3.1% | |
| Hobart | All Houses | 441.0 | 3.0 | 1.1% | -1.6% |
| All Units | 392.5 | 10.5 | 5.9% | -1.4% | |
| National | All Houses | 457.0 | 2.0 | 2.2% | 3.9% |
| All Units | 367.0 | 0.0 | 0.0% | 0.0% | |
| Cap City Average | All Houses | 534.0 | -4.0 | -0.6% | -2.4% |
| All Units | 419.0 | -1.0 | -0.9% | -4.6% | |
Source: www.sqmresearch.com.au
SQM’s calculations of vacancies are based on online rental listings that have been advertised for three weeks or more compared to the total number of established rental properties. SQM considers this to be a superior methodology compared to using a potentially incomplete sample of agency surveys or merely relying on raw online listings advertised. Please go to our methodology page for more information on how SQM’s vacancies are compiled.